Shiny web app
Custom Shiny web app for Daily Fantasy Football
I have used many different fantasy football lineup creation tools and data services and have always been frustrated by the slow nature and lack of integration without external information. Therefore, I wanted to develop my own tool for these purposes which was faster and better fit my personal needs.
I turned to Shiny web apps for this purpose to develop a custom app for displaying NFL statistics. This was an involved project which required web scraping in R using different websites such as footballoutsiders, pro-football-reference, and 4for4. The project itself was a way to use a personal-interest project to develop a new skill within web-apps and interactive data visualization.
A link to the app can be found here: Fantasy Football Shiny App
A link to the GitHub repository can be found here: Fantasy Football GitHub
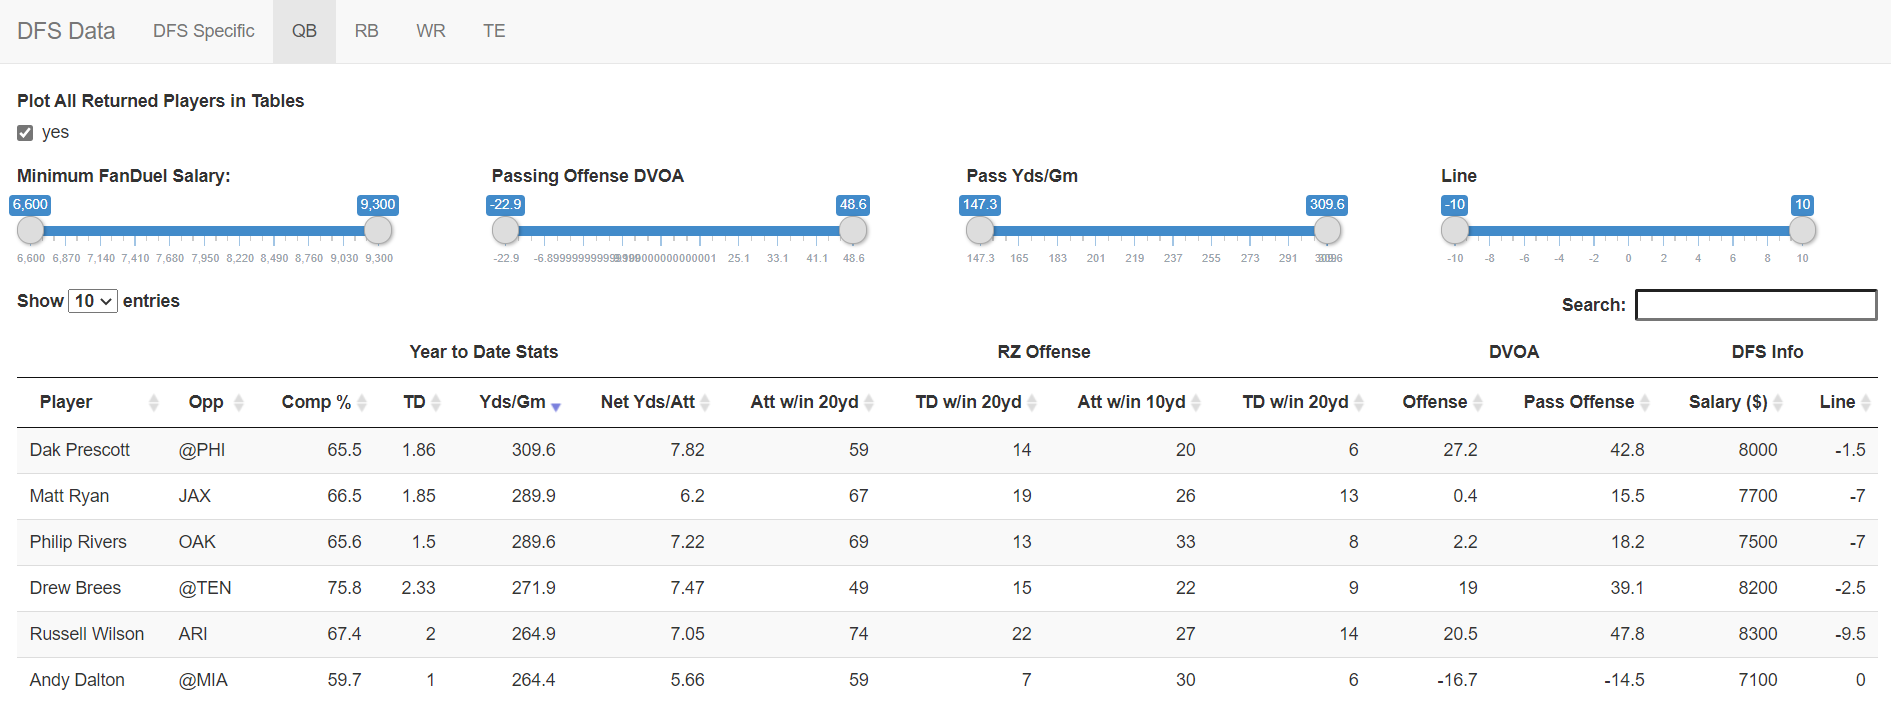
The app features sortable tables (pictured below) with sliders. There is a table for offensive stats and one for opposing team defensive stats. The tables are also searchable.
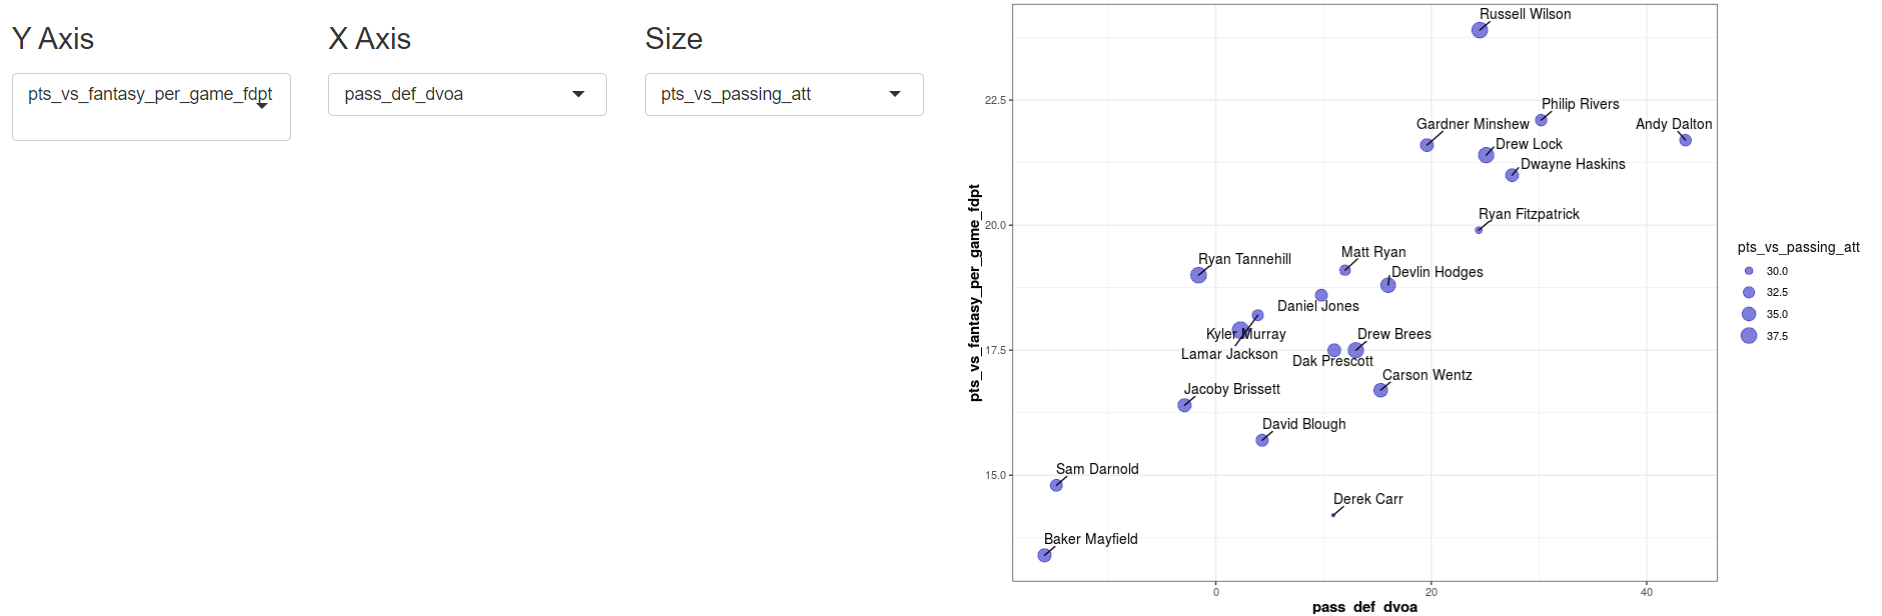
In addition, there are interactive plots below. The plots will display all results in the table (default), but this can be disabled and the app will show players clicked on in the table. Additionally, the y axis, x axis, and size of the circle can be altered to display any of the variables within the table. These tables were created using ggplot2 with dynamically coded data frame.
The 2019 season was focused on bringing the app “to life” along with getting the web scraping/dataframe creation code robust, as some websites change their reporting throughout the season. The next steps, especially during the offseason, are to:
- create a SQL database using the collected data
- train machine learning models for each position to predict outcomes (fantasy football points)
- Re-write the web-scraping code to export data into the SQL database which will streamline the web-app code in the future.
- This point may seem redundant to the work that has already been completed. However, there are many duplicate types of names within the aggregated dataframe (due to the nature of the task). I have created a naming convention to get around this but-as viewable in the y axis picture above, it can be confusing for others and is laborious to look at.